Quality Control analysis of the MaxQuant evidence file
Source:R/qualityControlEvidenceBasic.R
artmsQualityControlEvidenceBasic.RdQuality Control analysis of the MaxQuant evidence file
artmsQualityControlEvidenceBasic(
  evidence_file,
  keys_file,
  prot_exp = c("AB", "PH", "UB", "AC", "APMS", "PTM:XXX:yy"),
  output_dir = "qc_basic",
  output_name = "qcBasic_evidence",
  isSILAC = FALSE,
  plotINTDIST = FALSE,
  plotREPRO = FALSE,
  plotCORMAT = TRUE,
  plotINTMISC = TRUE,
  plotPTMSTATS = TRUE,
  printPDF = TRUE,
  verbose = TRUE
)
Arguments
| evidence_file | (char or data.frame) The evidence file path and name, or data.frame |
|---|---|
| keys_file | (char or data.frame) The keys file path and name or data.frame |
| prot_exp | (char) Proteomics experiment. 6 options available:
|
| output_dir | (char) Name for the folder to output the results plots. Default is "qc_basic". |
| output_name | (char) prefix output name (no extension). Default: "qcBasic_evidence" |
| isSILAC | if |
| plotINTDIST | if |
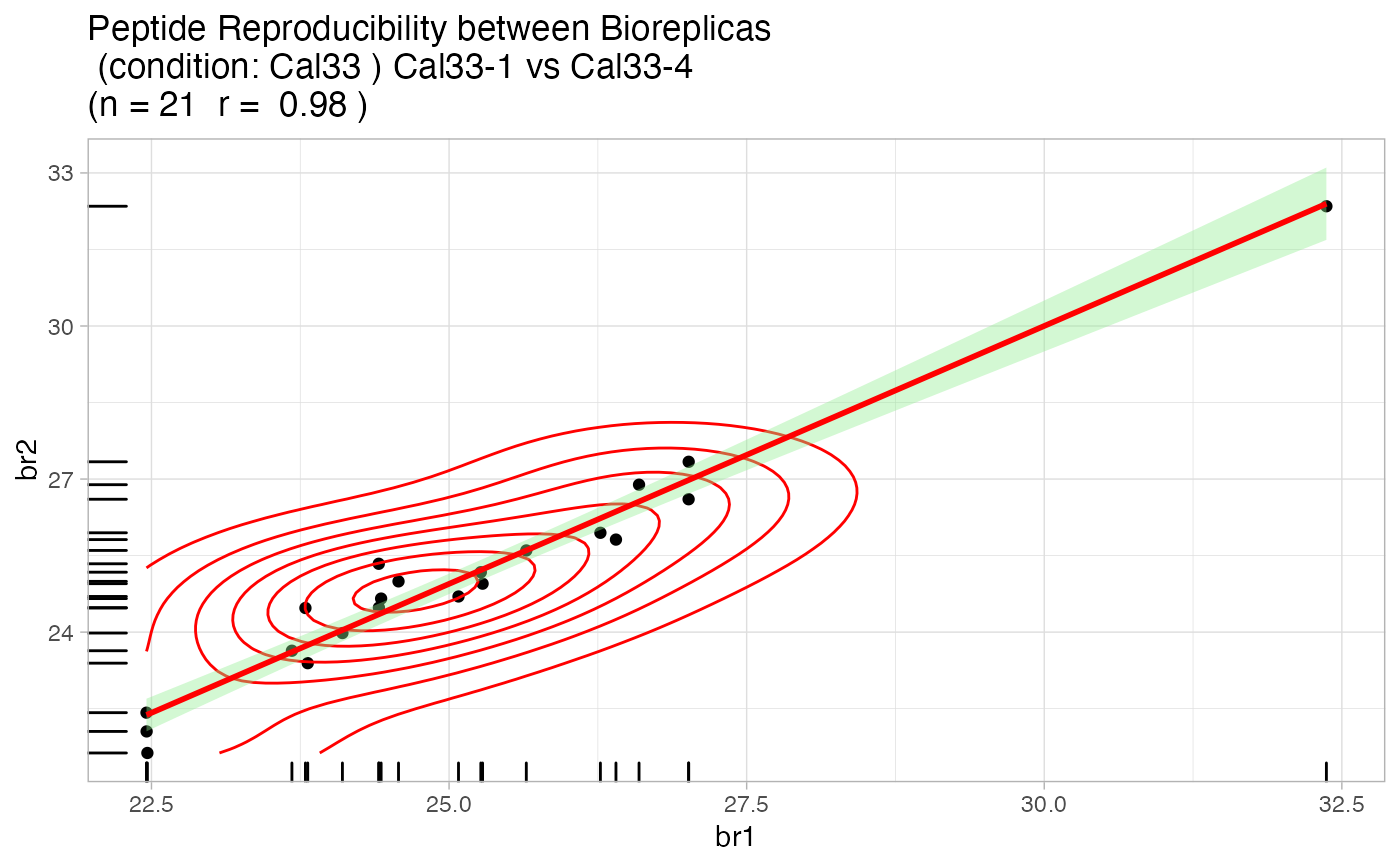
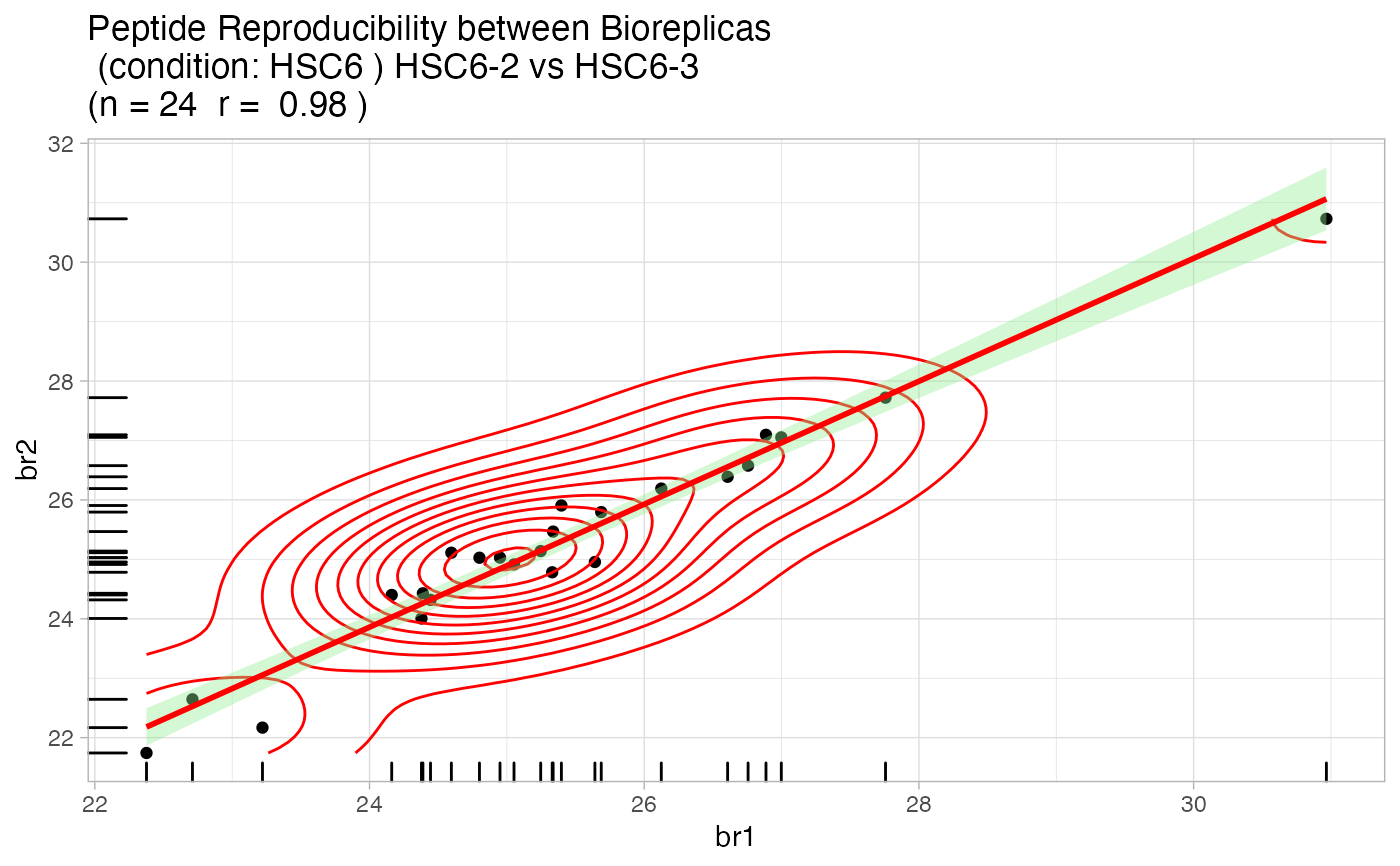
| plotREPRO | if |
| plotCORMAT | if
|
| plotINTMISC | if |
| plotPTMSTATS | IF |
| printPDF | If |
| verbose | (logical) |
Value
Quality control files and plots
Examples
artmsQualityControlEvidenceBasic(evidence_file = artms_data_ph_evidence, keys_file = artms_data_ph_keys, prot_exp = "PH", isSILAC = FALSE, plotINTDIST = FALSE, plotREPRO = TRUE, plotCORMAT = FALSE, plotINTMISC = FALSE, plotPTMSTATS = FALSE, printPDF = FALSE, verbose = FALSE)# But we recommend the following test: # 1. Go to a working directory: # setwd("/path/to/your/working/directory/") # 2. Run the following command to print out all the pdf files # artmsQualityControlEvidenceBasic(evidence_file = artms_data_ph_evidence, # keys_file = artms_data_ph_keys, # prot_exp = "PH") # 3. Check your working directory and you should find pdf files with # all the QC plots